
It is assumed you already created resource Control API end added exporter to it.
This guide will walk you through creating a custom template for the Control API application, that is part of I&B platform.
Control API runs on node.js so we use prom-client to instrument a monitoring of our own application.
Depending on technology your application is build on, you can use appropriate metrics exporter from Prometheus or just search it.
We prepared table with some Control API metrics here.
Naturally, your metrics may differ from ours, so you will likely need to use PromQL to tailor them to your specific requirements.
Create new template.
To create new template navigate to 
Click on 
Enter into Create new template form
Template Name: control-api.
Template description: I&B platform control api template.
In the 'Select Subunit or Layer' section, choose 'Layer' from the drop-down menu. This means the template will be used to monitor an IT service.
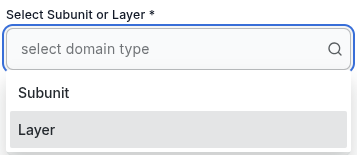
Leave Copy from field with none as we will create template from a scratch. As an alternative, you may create a new template using an existing one as a base.
From Operation domain drop-down menu select Applications as we want to monitor this layer.
In Exporter field select prom-client and click Create button.
You can see created template in templates list.

You may notice that the owner of this template is user , while the owners of other templates are I&B platform.
Platform templates cannot be deleted through the actionsmenu; however, they can be edited.
Click on control-api template.
Currently there is no metrics in it - click on 
Fill in fields from prepared I&B platform Control API table, for example
Metric Name: get user data
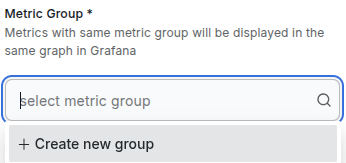
Metric Group: As this is a newly created template, no metric groups are currently available. Click on drop-down menu and select Create new group and enter in new window requests rate.
Create issue: no
Layer / Subunit: no
Service / Business unit: no
Business: no
Metric Formula: rate (http_requests_total{route="/v2/user/:email", method="GET", status="200"}[60s])
Click the 
Measurement: r/s - short from request per second
Thresholds and Comparator: For this particularly metric we set threshold < 0, so it will never be crossed - that exactly we needed for such kind of metric. This is for informational purposes only and has no impact on functionality.
If all mandatory fields entered correctly - click Create.
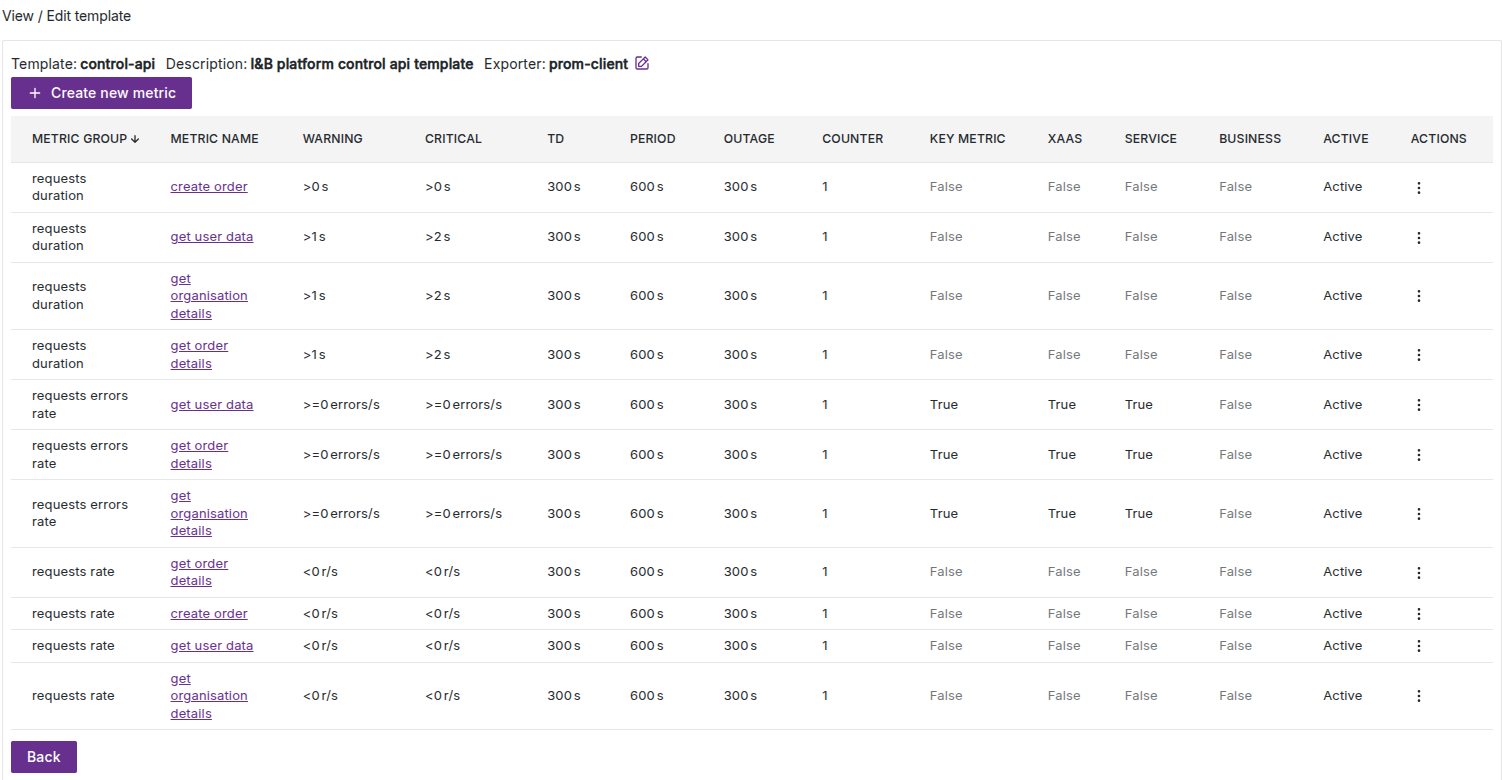
By the end, you will have a simplified template for monitoring the Control API application:
To check template metrics navigate to Dashboard → Resources, select resource control-api.dev.svc.cluster.local and template control-api.
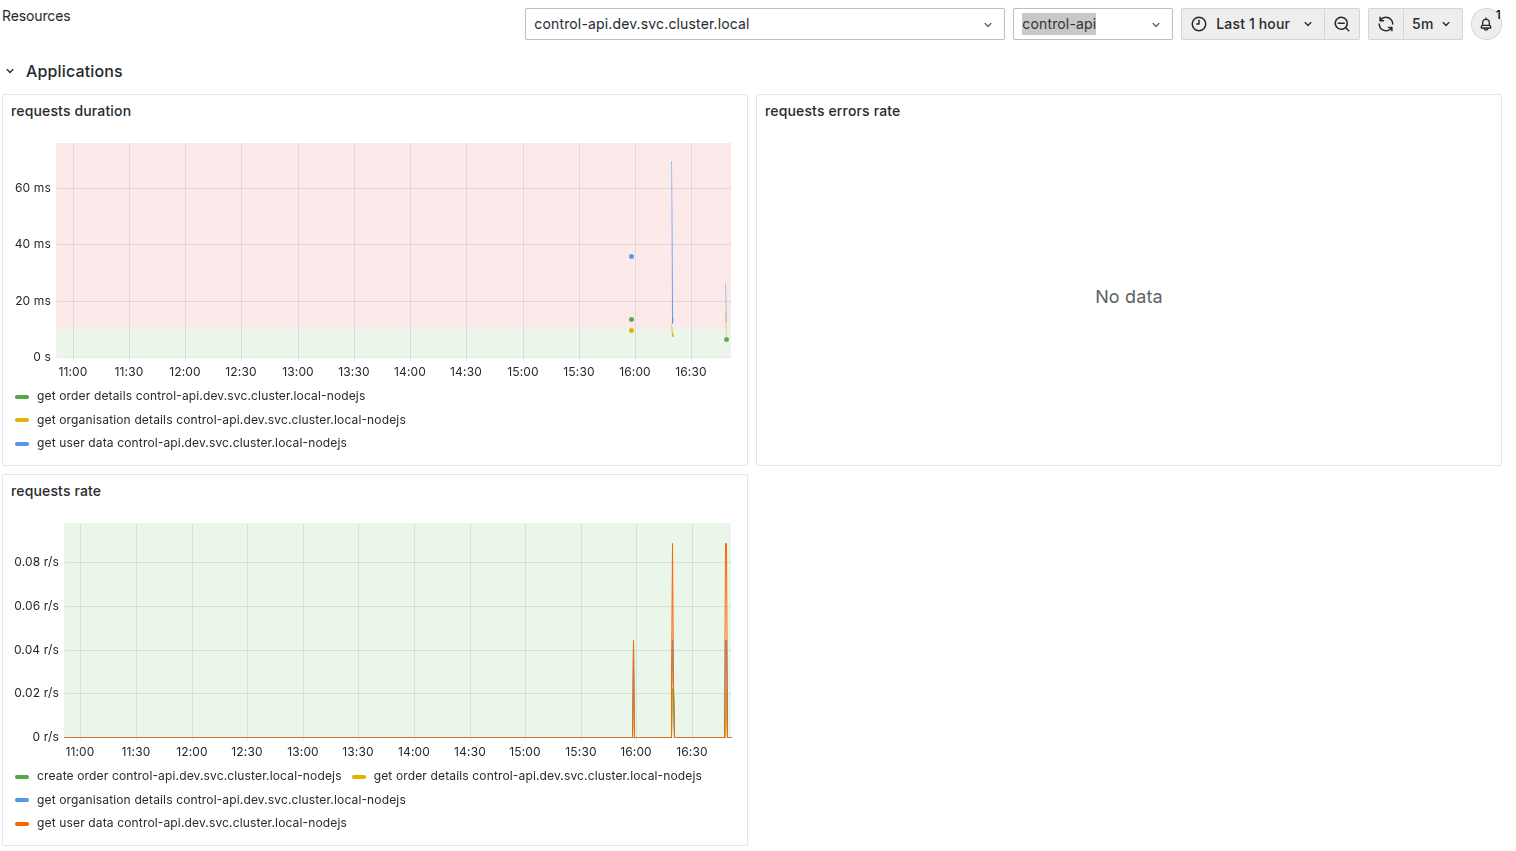
Data is visible in the Request Duration and Request Rate panels.
Since the application has no errors, the Error panel correctly shows no data.