It is assumed you already created account on I&B monitoring platform with active (trial or paid) subscription.
Sign in to your monitoring service instance.
Sign in to your Account console on I&B monitoring platform with one of identity providers:



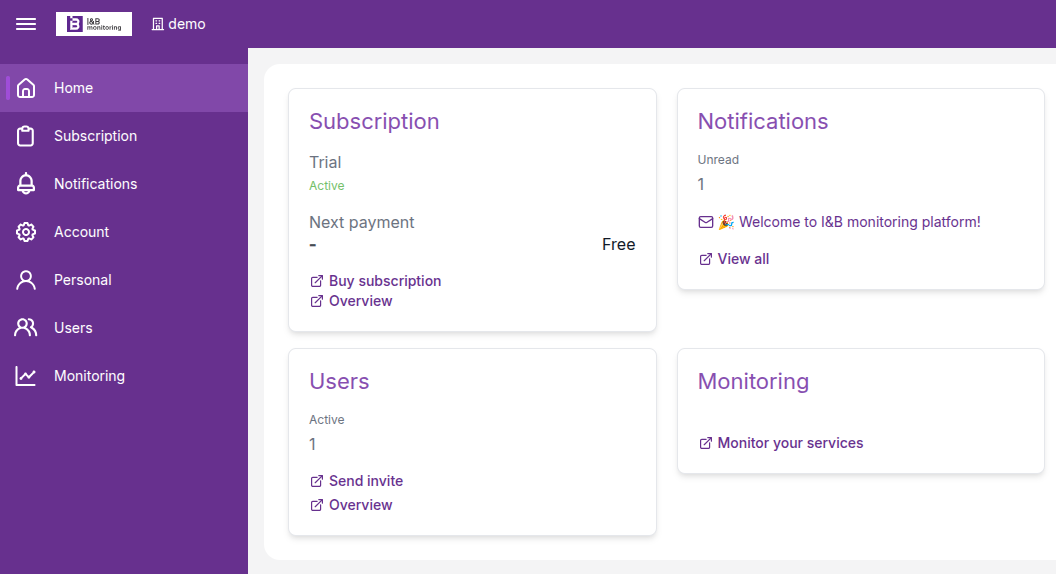
In Account console click on 
A new page will be opened, displaying two applications:

Add Resource
In order to configure monitoring of I&B monitoring we need to add resources used to collect metrics.
In “Configurator” app select “Resources” menu 
Then click Add resource button 
In the opened window:
-
Select whether to use DNS for hostname resolution (in this case hostname is mandatory field);
-
From drop-down menu choose type of resource;
-
Enter
hostnameandIP address.
Add Exporter
It is assumed you already installed exporter in your infrastructure. Refer to Prometheus documentation.
We are strongly recommend you will use secure TLS connection to exporter. See the HTTPS and authentication for more details.
During exporter configuration you may enter sensitive information: exporter’s name, password, certificate.
I&B platform collects metrics from exporters installed on resources in your infrastructure. You should allow inbound connection from I&B platform on your firewall from IP address, displayed in Resources menu: Inbound IP address.
Once a Resource has been created, it will appear in the resource list.
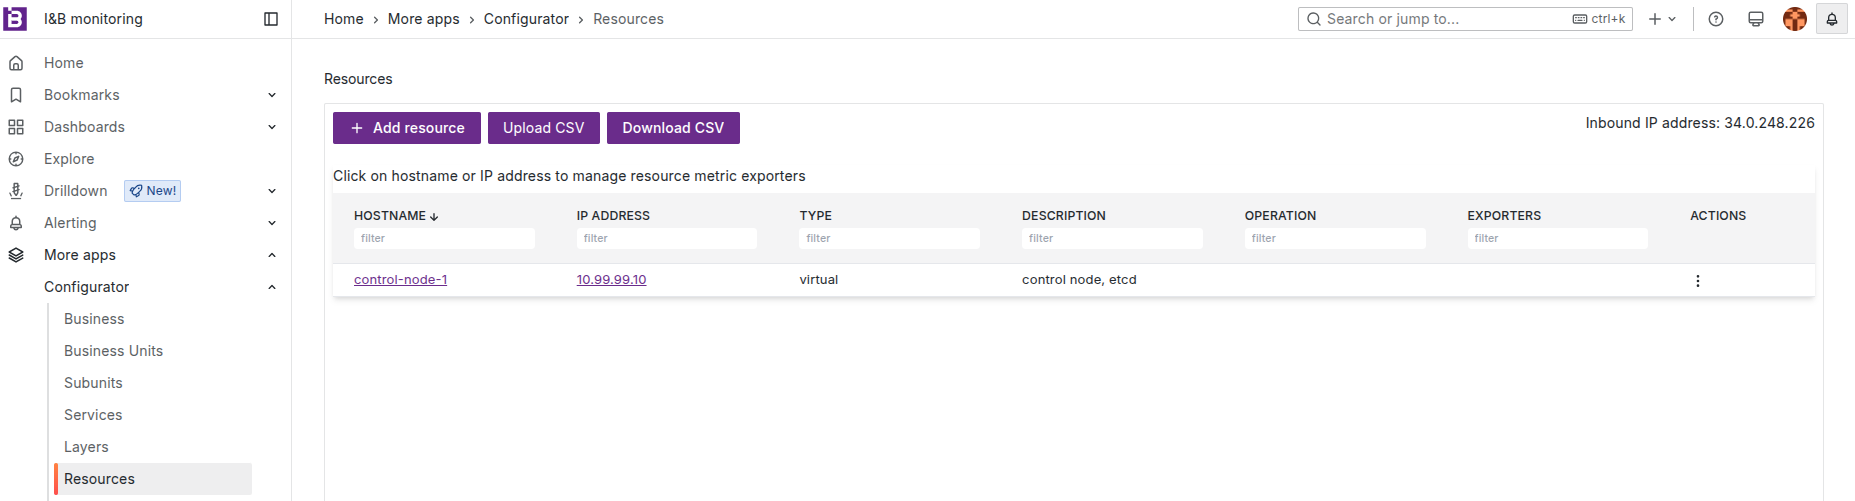
Click on hostname or IP address to manage exporters on that resource.
A table will display the exporters installed on the resource — currently, it is empty.
Click 
In the opened form:
-
Select Exporter from drop-down list;
-
Modify if needed default exporter’s Path and Port;
-
Paste or Upload exporter’s Certificate;
-
Enter exporters' name and password;
-
Click


How to view collected metrics?
Navigate to application Dashboard and select
Select added resource from drop-down list.
A set of charts will be displayed, visualizing the collected metrics.
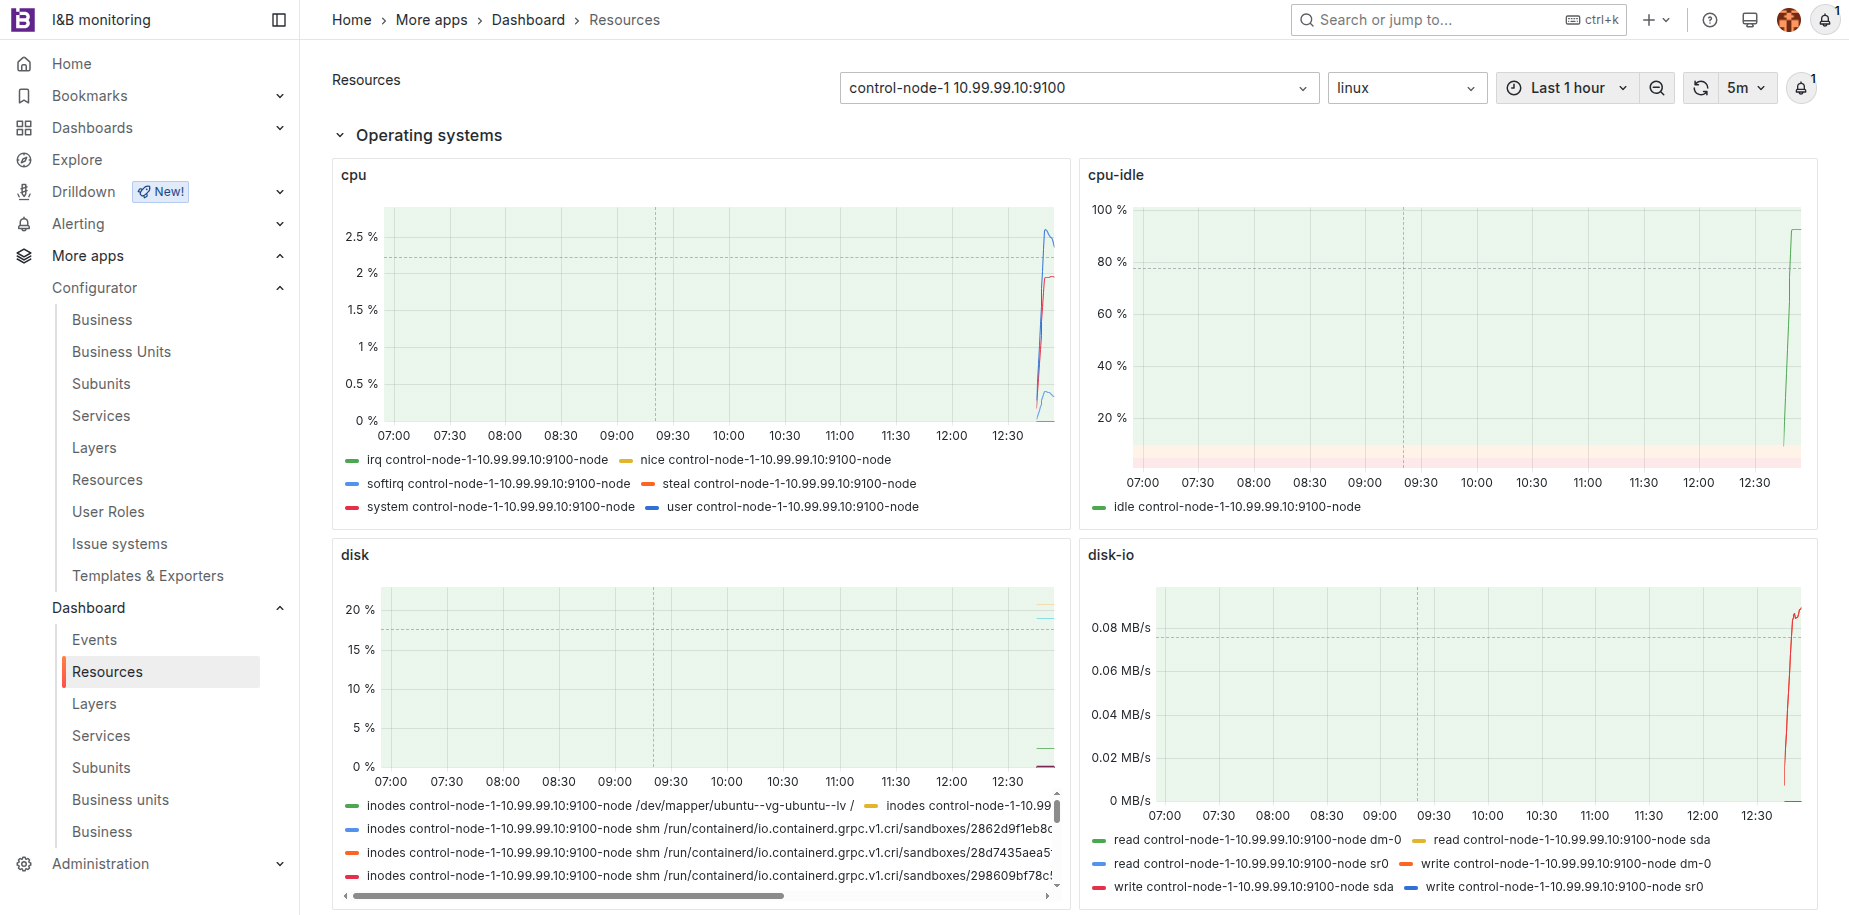
If you just added resource and exporter it could take some time before you can see data.
List of charts are defined by template, that is related to exporter.
In the same way add following resources:
-
Operating systems layer
-
Container platforms layer
-
Databases layer
-
Applications layer
Each of the resources mentioned above can be monitored through preconfigured templates provided by the I&B monitoring platform.
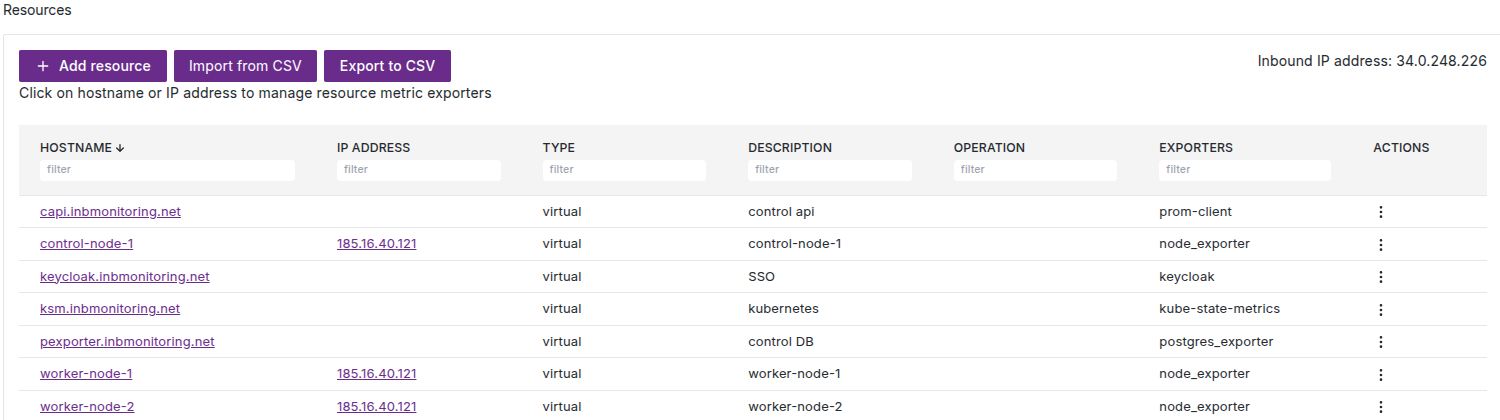
After completion adding resource and exporters you should have following table: