
Once resources have been created, exporters added, and templates defined, the next step is to configure the Service.
Navigate to 

Enter service name, for example, I&B platform and click 
Click on service name (here I&B platform) to manage monitoring cards.

A new page with a list of monitoring cards will open (currently, it is empty):

The next step is to add all previously created resources and templates, including the metrics that indicate service health across various Layers.
Click on 

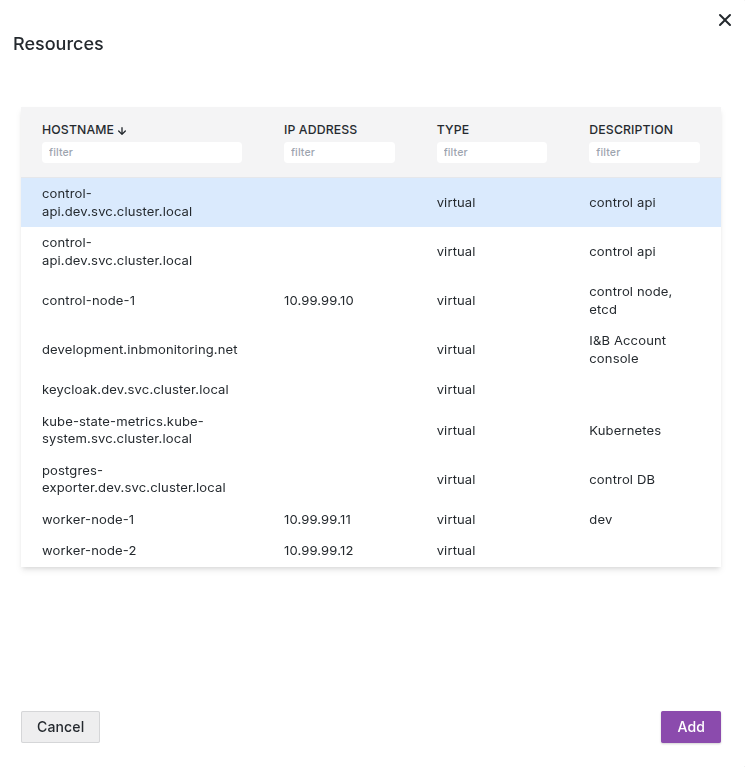
A list of resources created in earlier steps will appear in the new window. Select the first resource and click Add to proceed.
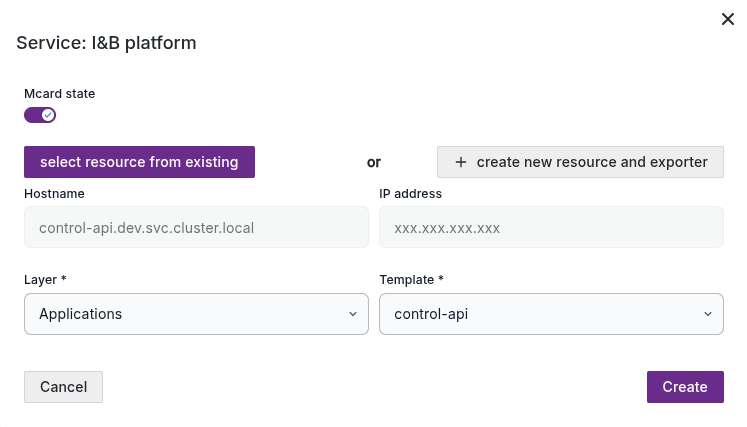
In Layer field select Applications and in template field select control-api, then click Create.
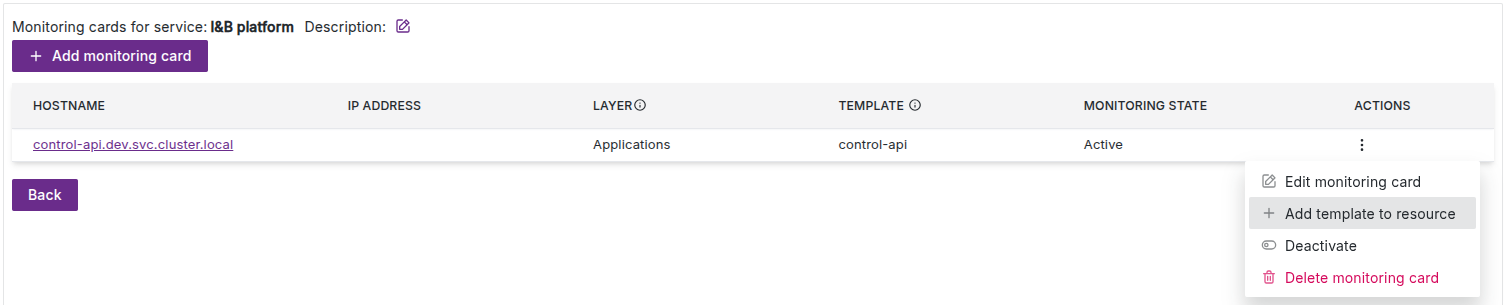
🎉 The first monitoring card has been successfully added to your service!

As prom-client allows collect not only custom metrics, but Node.js as well, we should add this template too. Clock on Actions menu and click Add template to resource.
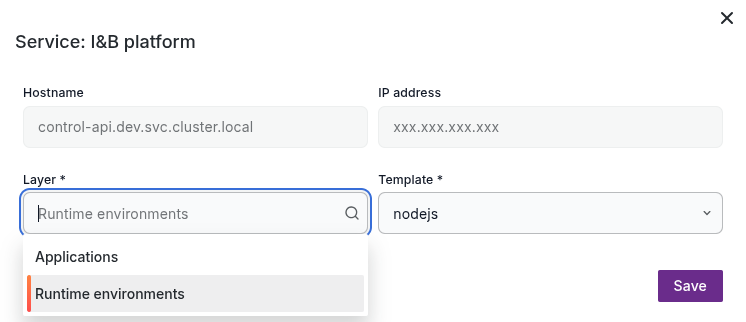
In Layer drop-down window select Runtime environments. Respective nodejs template also will be selected. Then click Save.
As shown, two templates are currently applied to the resource. However, you can apply as many templates as necessary.

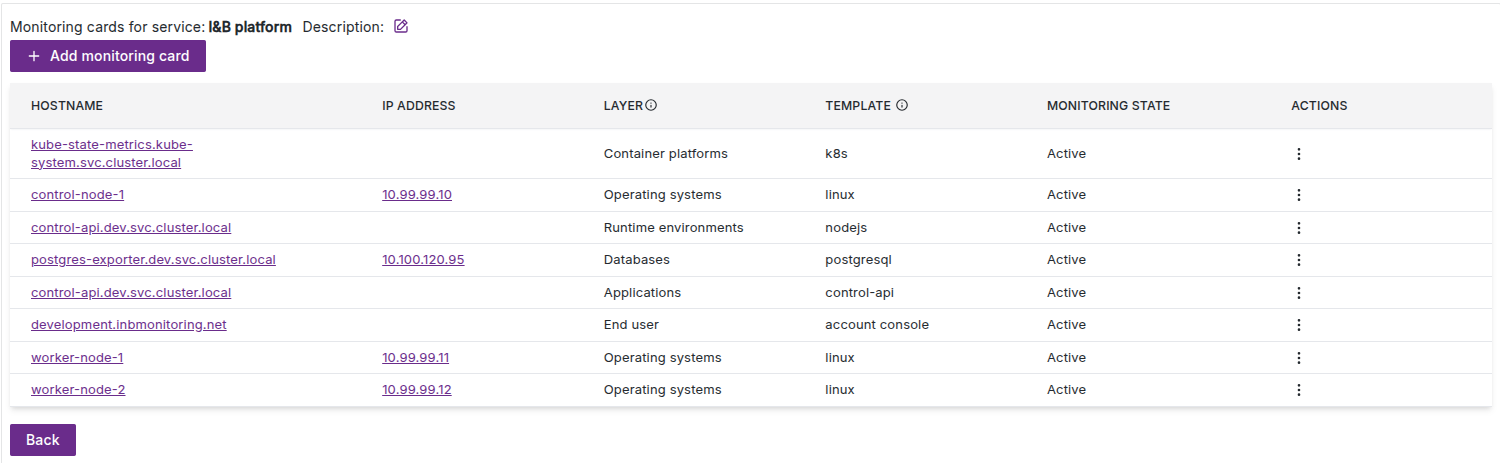
Once you have added all resources and templates to the service monitoring card, the resulting list should appear as follows:
You can now view the I&B platform status, along with an overview and detailed metrics, on the Dashboard automatically generated for the service you just created.