
Business relies heavily on IT, but many monitoring tools only display technical resource metrics. Most of them don’t show business KPIs - and some don’t even provide the status of the IT service itself.
I&B monitoring is a cloud platform designed to give you full visibility into your Business, IT services and Infrastructure - all in one place.
Business
“Business is the practice of making one's living or making money by producing or buying and selling products (such as goods and services). It is also "any activity or enterprise entered into for profit.”
Wikipedia.
Business unit
A Business Unit is an organizational part of a Business. Examples include Delivery, Procurement, Inventory, and others.
Each Business Unit can also be divided into several Subunits.
IT service
“An IT service is a set of related functions provided by IT to support business processes, deliver value to users, and enable desired business outcomes. It often includes support, maintenance, infrastructure, applications, and user assistance.”
ChatGPT.
IT infrastructure
“Information technology infrastructure is defined broadly as a set of information technology (IT) components that are the foundation of an IT service; typically physical components (computer and networking hardware and facilities), but also various software and network components”.
Wikipedia.
How the Business, Business Units, and Services are connected?
The Business, Business Unit, and Service are connected in a way similar to a company’s organizational structure. For example, I&B monitoring simplified schema:
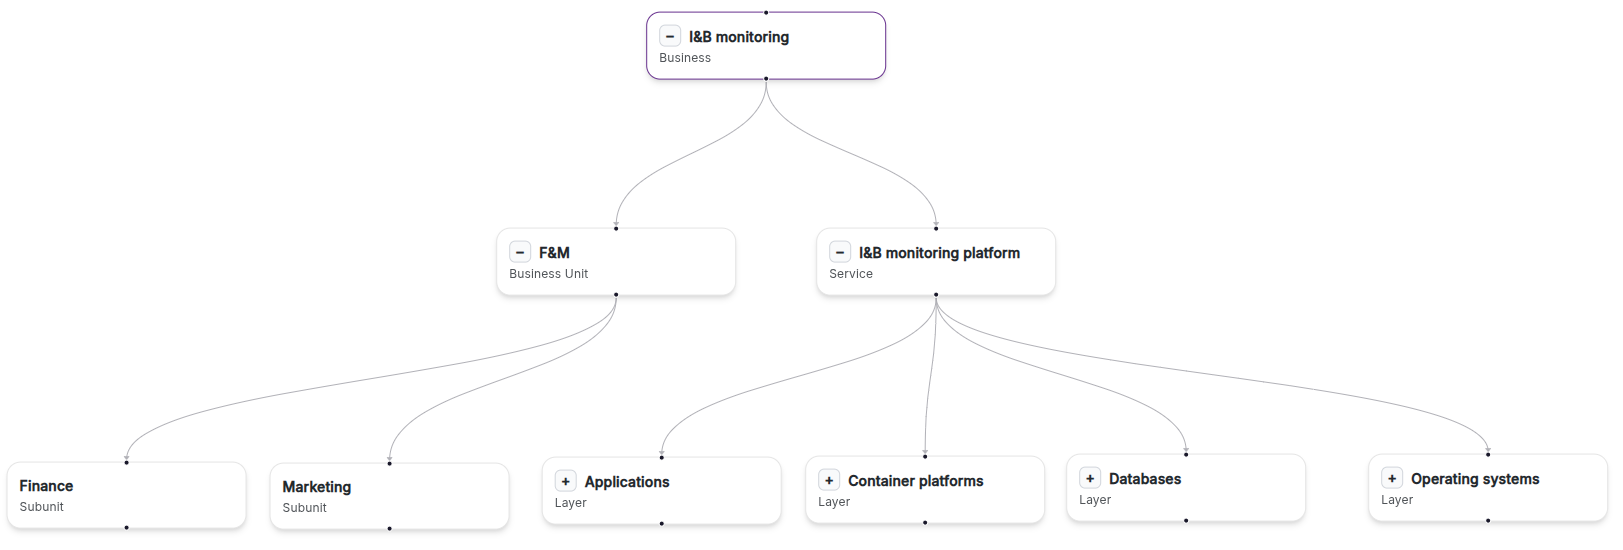
IT service layer/ Business subunit
A layer is a logical level within an IT system architecture, each with its own specific function that helps organize and separate responsibilities (e.g., presentation, application logic, data management, infrastructure). Examples of layers include operating systems, databases, and applications.
The service layers shown in the picture can represent both technical and organizational structures. Each layer is typically managed by a dedicated team or organizational unit with specialized skills. In many companies, engineers responsible for different technical domains work within specific IT subunits — such as the Servers & Infrastructure team, the Database team, the Applications team, and others.
Layers and subunits help logically group resources (or business KPIs) and the metrics collected from them.
Underlayers
Grouping layers into underlayers can be helpful because engineers responsible for servers usually manage the related technologies as well.
For example, the underlayers of a Server Platform include:
-
Hardware,
-
Operating System,
-
Storage.
Resources
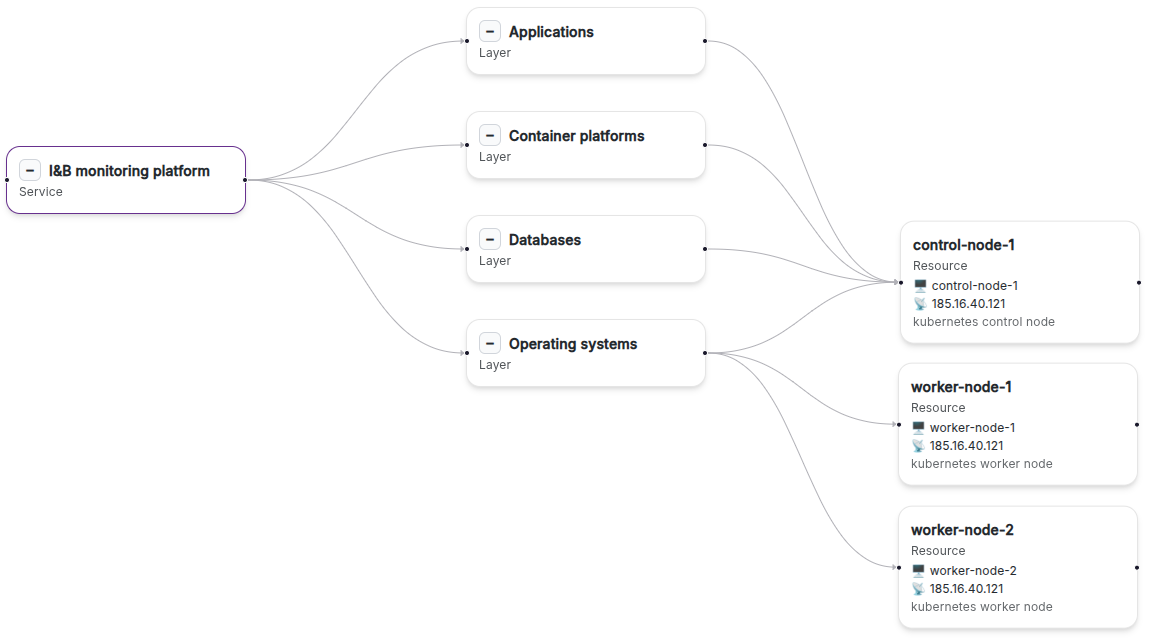
Ultimately, all metrics are collected from resources. Examples include servers, storage systems, network devices, or the URL where your application is available. These resources can be physical, virtual, or containerized.
Depending on their function, each resource belongs to a specific layer. For example:
Exporters, templates and metrics
IT Services & infrastructure monitoring
On I&B monitoring platform metrics (for example, system CPU usage) are collected with Prometheus exporters.
Example of relations between resources, exporters and templates is shown in picture below:
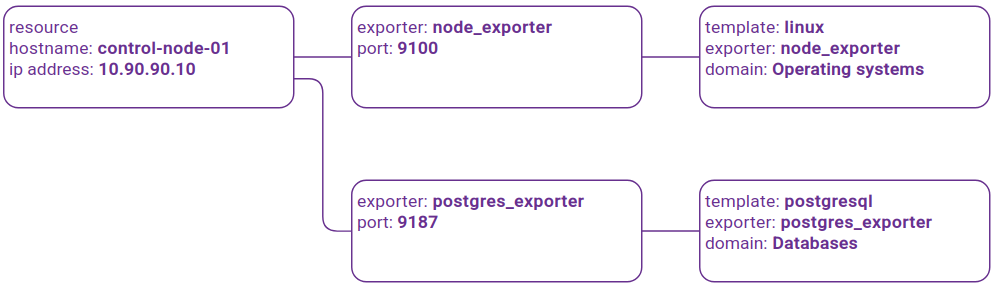
Multiple exporters can be installed on a resource, and each exporter can use several templates.
Templates help group metrics related to a specific resource type — for example, Linux servers or PostgreSQL databases.
An exporter can collect hundreds and thousands of metrics from a resource.
In addition to raw metrics (such as the total number of requests), the system can also calculate and aggregate metrics — for example, the average request rate over the last 5 minutes or 1 hour — using Prometheus Query Language (PromQL).
Our goal is to ensure that all templates follow industry best practices. While some services may have unique requirements, we expect that for most general-purpose IT services, engineers will find the provided metrics and thresholds sufficient and helpful.
XaaS (Everything/Anything as a Service) approach to IT services monitoring
Business KPIs monitoring
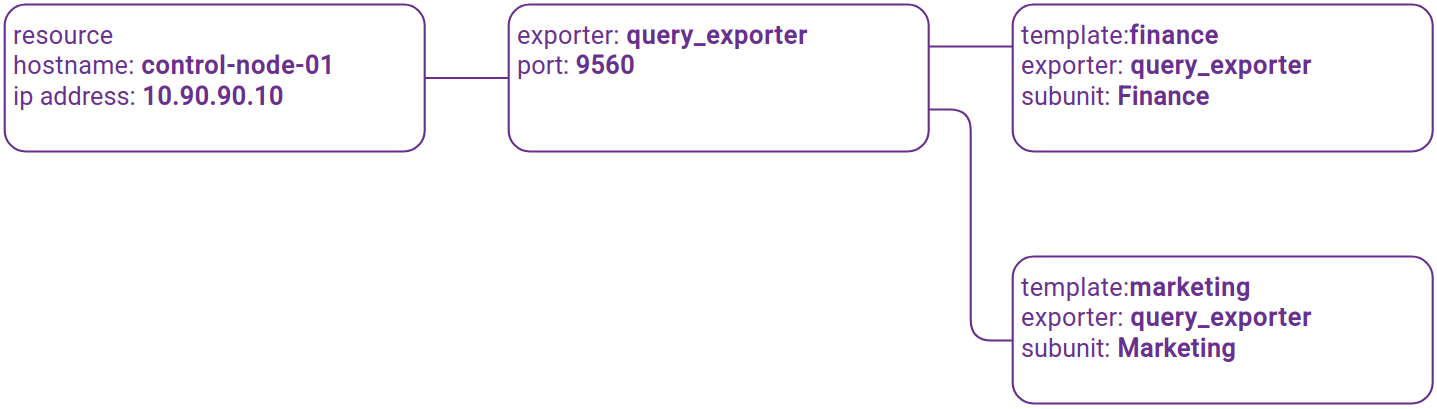
The example below shows how resources, exporters, and templates relate to each other when monitoring business metrics:
Impact on business, service, layer
Each metric has attributes that define how it impacts on:
-
Business,
-
Service / Business unit,
-
Layer / Subunit.

If Layer / Subunit toggle is on - this metric will be included in respective dashboard:
-
Business,
-
Service / Business unit,
-
Layer / Subunit.
Dashboards
The I&B monitoring platform includes a set of predefined dashboards designed to meet the needs of different roles, including:
-
CEO (Business Owner, Chief Executive Officer)
-
CIO (Chief Information Officer)
-
Line-of-Business / IT Domain / Layer Manager
-
DevOps Engineer (IT Administrator)
Business dashboards
Business dashboards are primarily of interest to C-level executives.
Overall business status dashboard
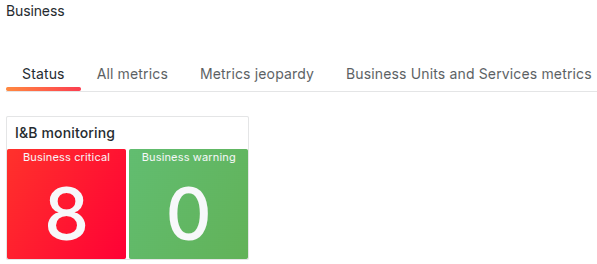
This dashboard shows the total number of business KPIs (metrics) that exceed their defined thresholds:
Business metrics jeopardy dashboard
The Metrics Jeopardy dashboard displays all business metrics that have crossed their defined thresholds.
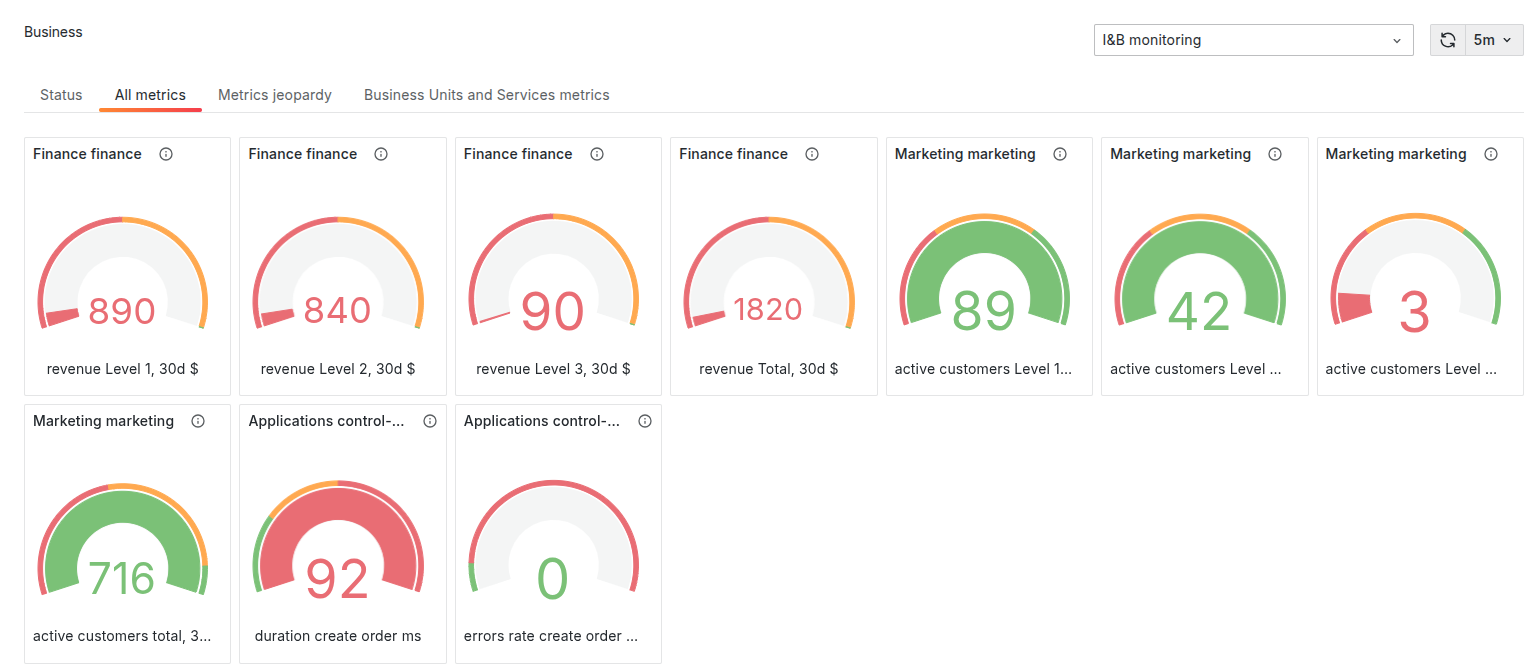
Here Level 1, 2, 3 - names of respective subscription plans.
Business Units and IT Services dashboards
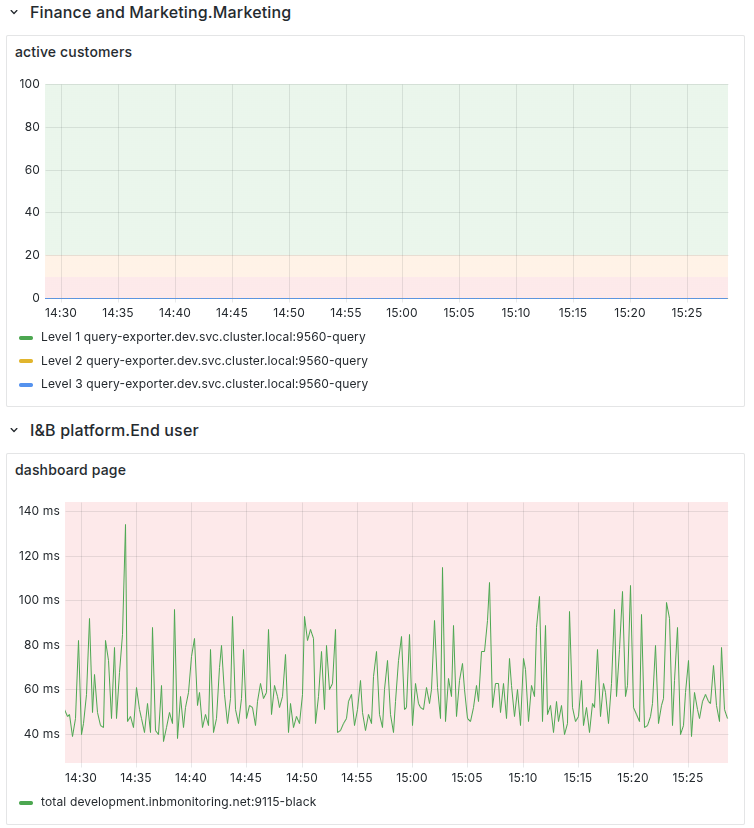
This view allows you to analyze key performance indicators for both business units and IT services.
Business units dashboard
This dashboard is typically used by Line-of-Business managers or, for example, the CFO.
It shows the key performance indicators of each business unit and its subunits.
IT Services monitoring dashboard
IT Services status dashboard
This dashboard is primarily used by the CIO and IT Service Owners.
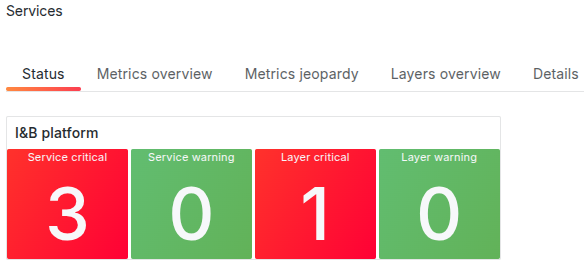
It shows the total number of IT services KPIs that exceed their defined thresholds.
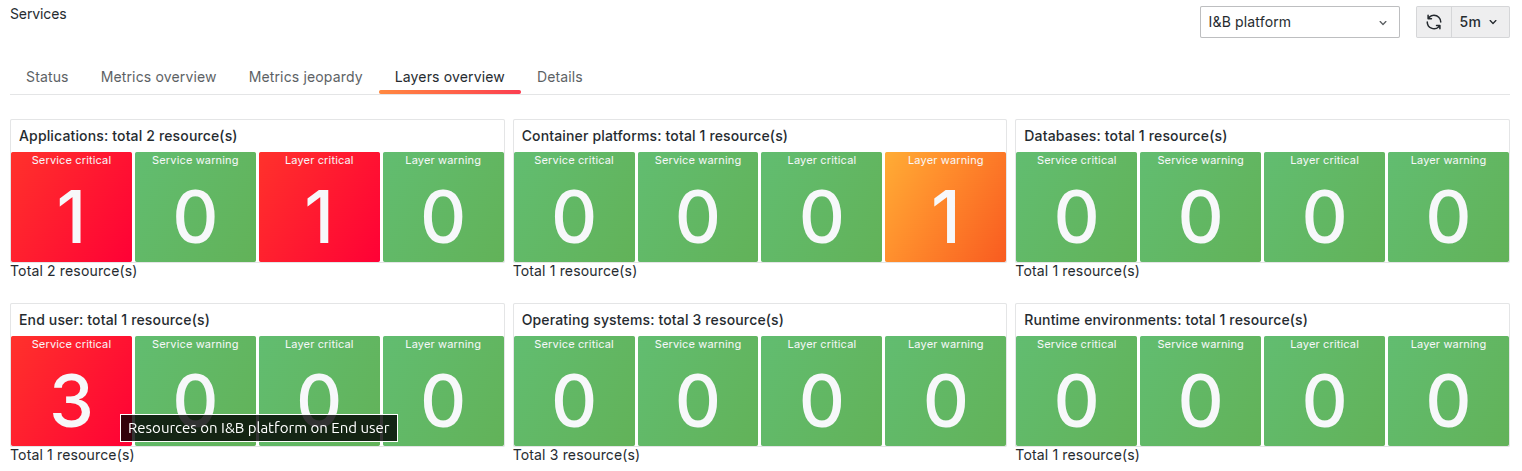
IT layers overview dashboard
IT Layers overview dashboard provides status of all layers that contributes service. You can drill down further to view information about specific IT resources.
Alerts context dashboard
On I&B platform we use following terms:
|
Term |
Definition |
|---|---|
|
Alert |
An alert is triggered when a situation requires the attention of a manager or engineer An event becomes an alert when the Outage or Count values exceed the thresholds defined for the metric. |
|
Count |
Count is the number of times a metric exceeds its critical threshold. |
|
Event |
Event is threshold violation of a metric (warning or critical). |
|
Issue |
Issue is a record in an issue management system, such as Jira, or tracked via email. |
|
Notification |
Notification is an alert delivered through the I&B monitoring platform. |
|
Outage |
Outage is a period when a resource or service is unavailable, meaning a metric has exceeded its critical threshold. |
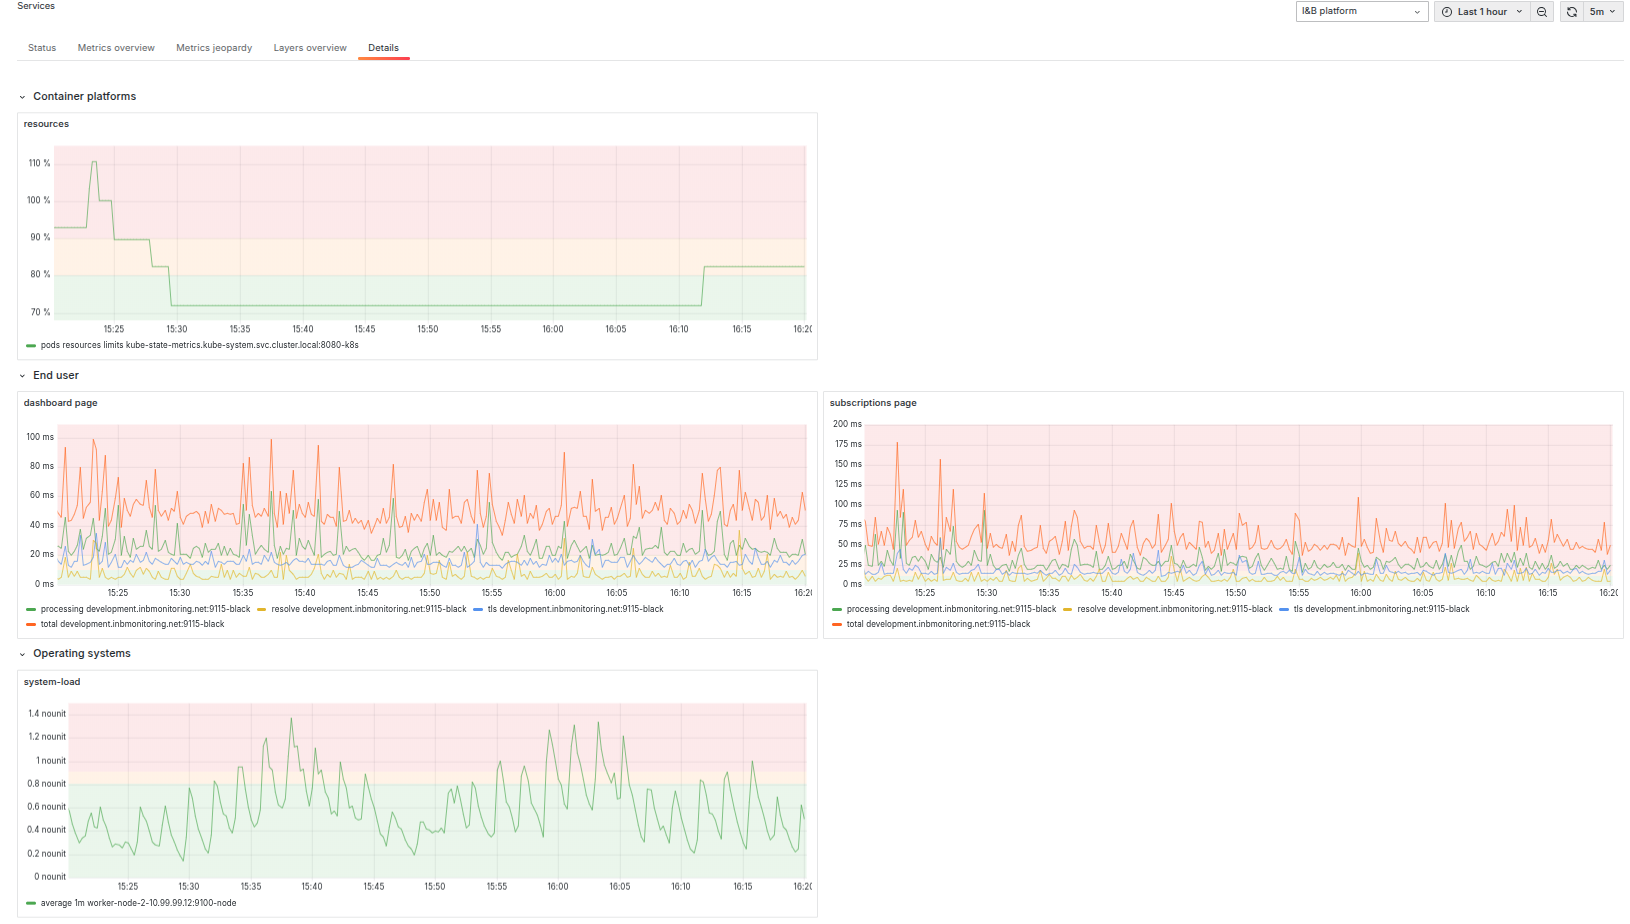
The Alerts Context Dashboard (we call it the 'Single Source of Truth') displays, on a single page, all IT service metrics across all layers that have crossed their thresholds. This greatly reduces the time needed to identify the root cause of a problem.
IT Resources dashboard
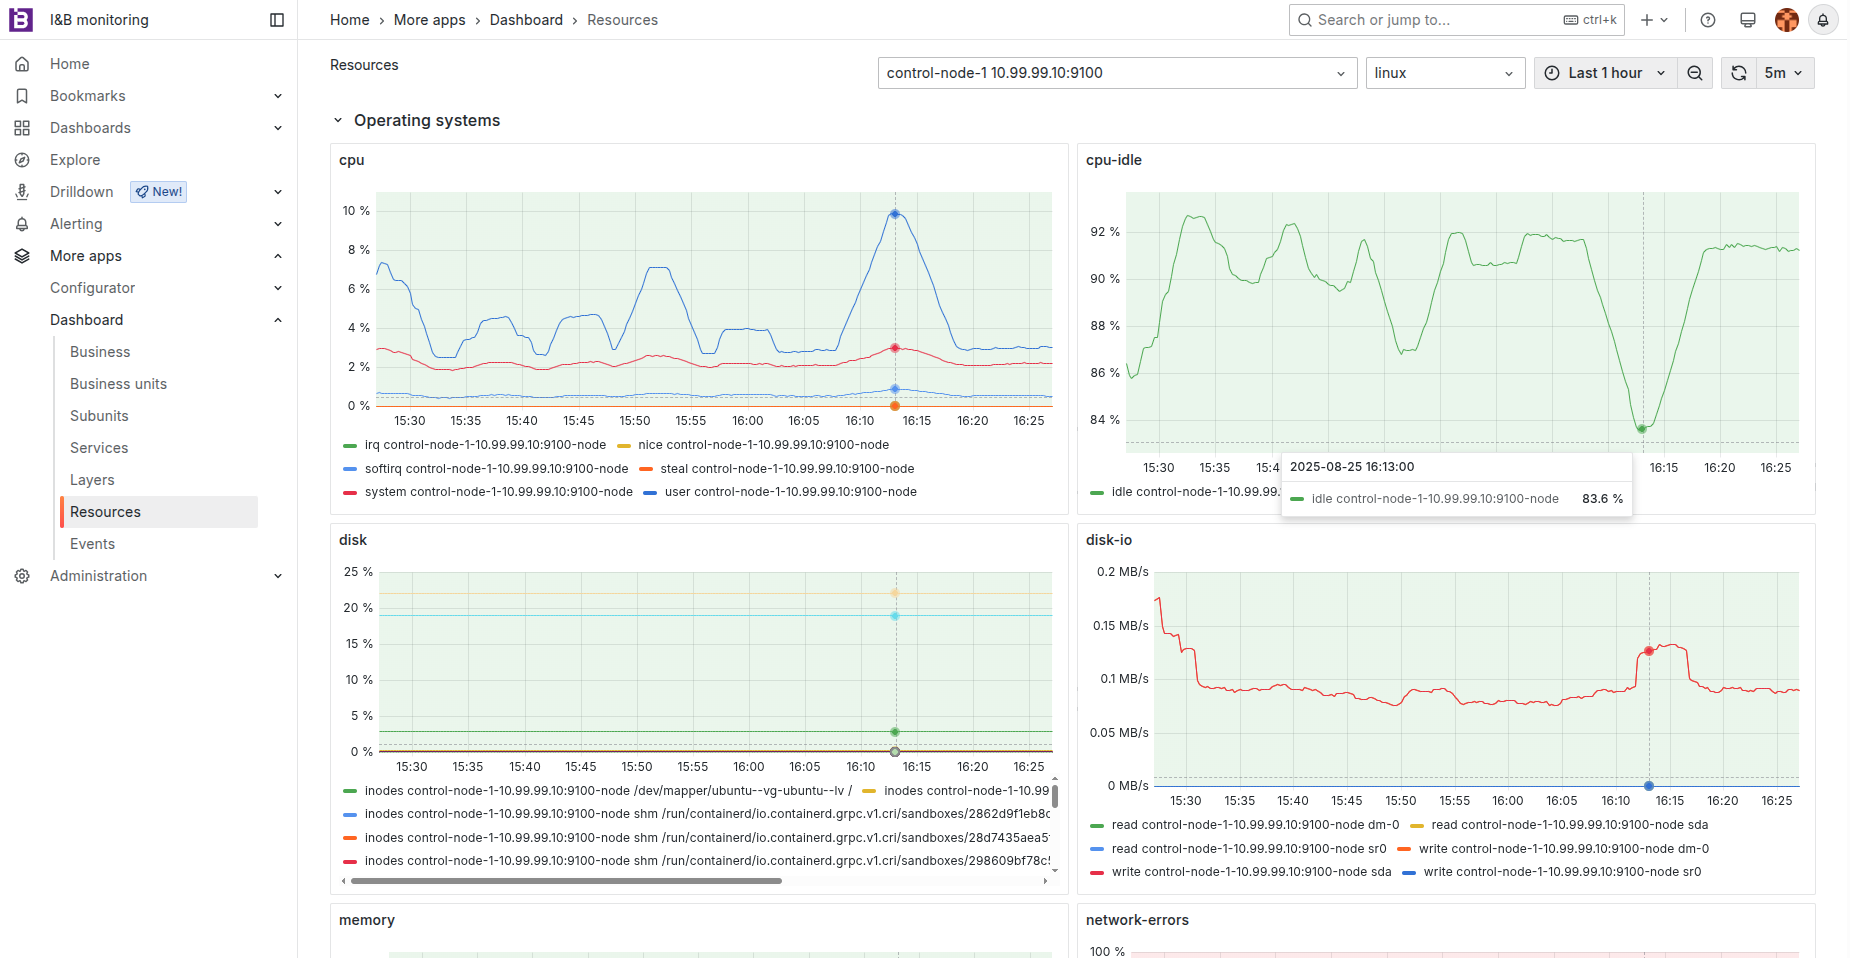
The IT Resources Dashboard provides information about all metrics for a selected IT infrastructure resource and its associated template.
Events dashboard
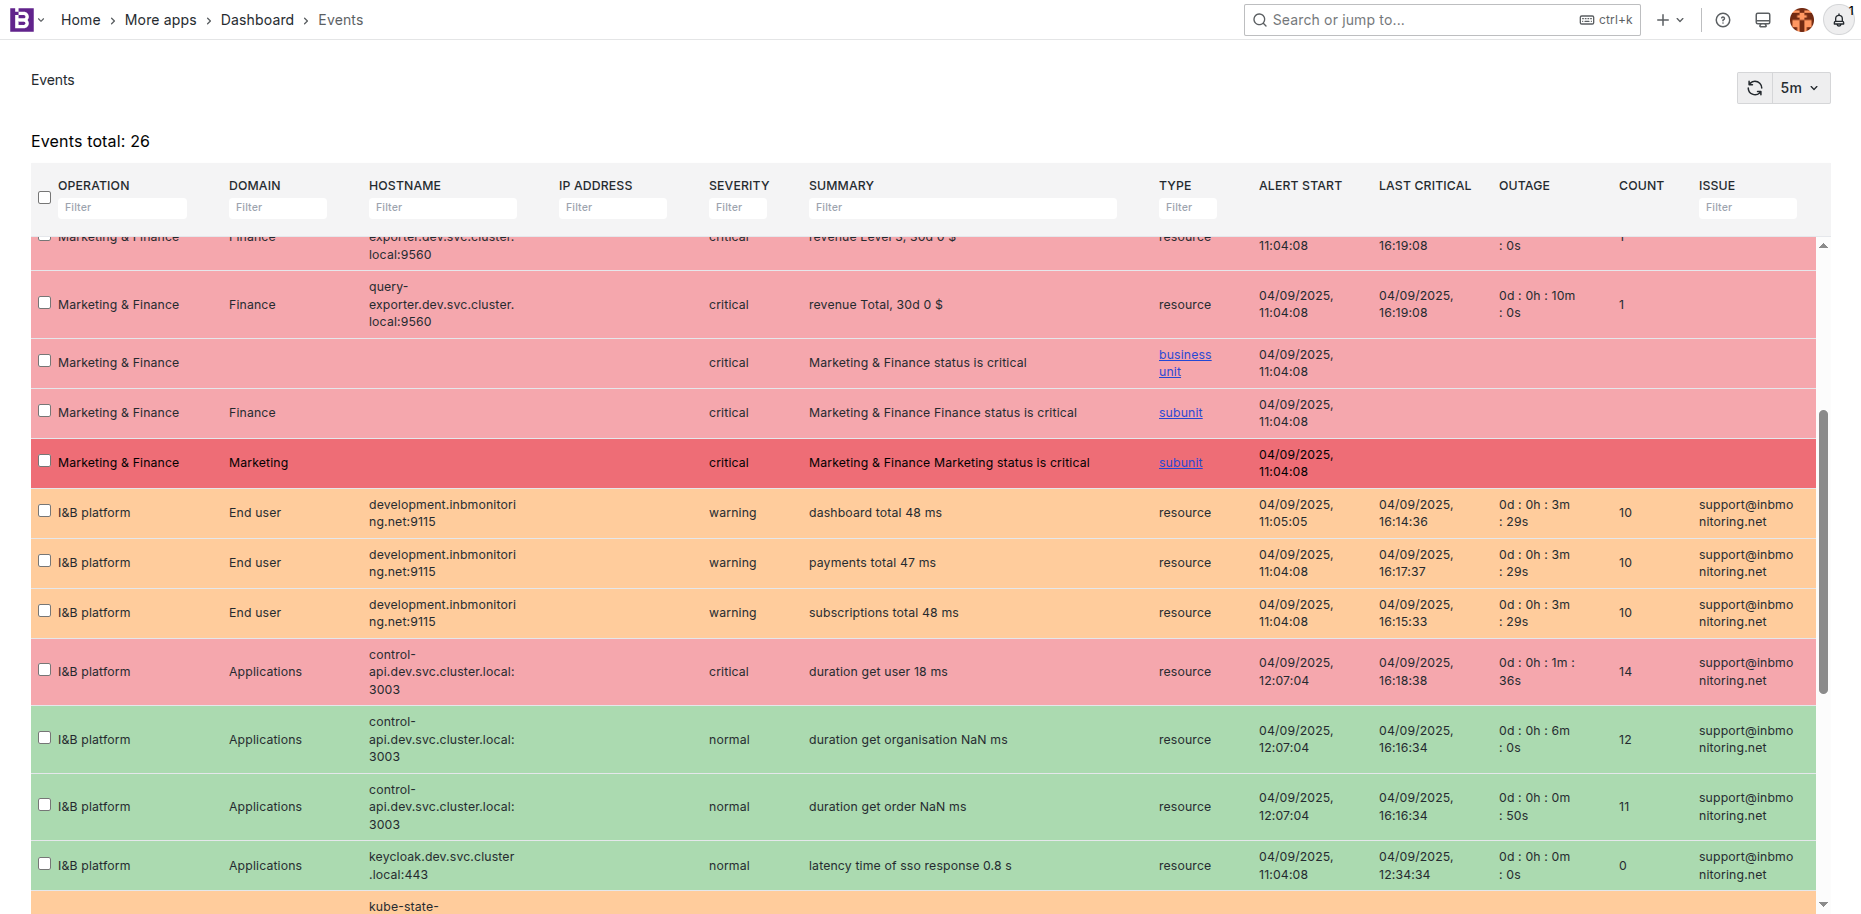
The Events Dashboard provides information about all events and alerts for the configured services and business units.
Issues and alerts notification
When an alert is created and the Create Issue option is enabled, an issue will be automatically created. Currently, Jira and Email are supported as destinations for creating issues. Here incident, trouble ticket are synonyms for issue term.
Responsible engineer can be designated for each operation and operation domains. So issue will be automatically assigned to them.
Once an alert or issue is created, no further alerts will be triggered. This effectively prevents alert spam and reduces alert fatigue.
An issue can also be created at the layer (subunit), IT service (business unit), or business level. In this case, the alert or issue includes information about all jeopardy metrics from all child operations and domains (underlayers).
Here is an example of an issue created via email.
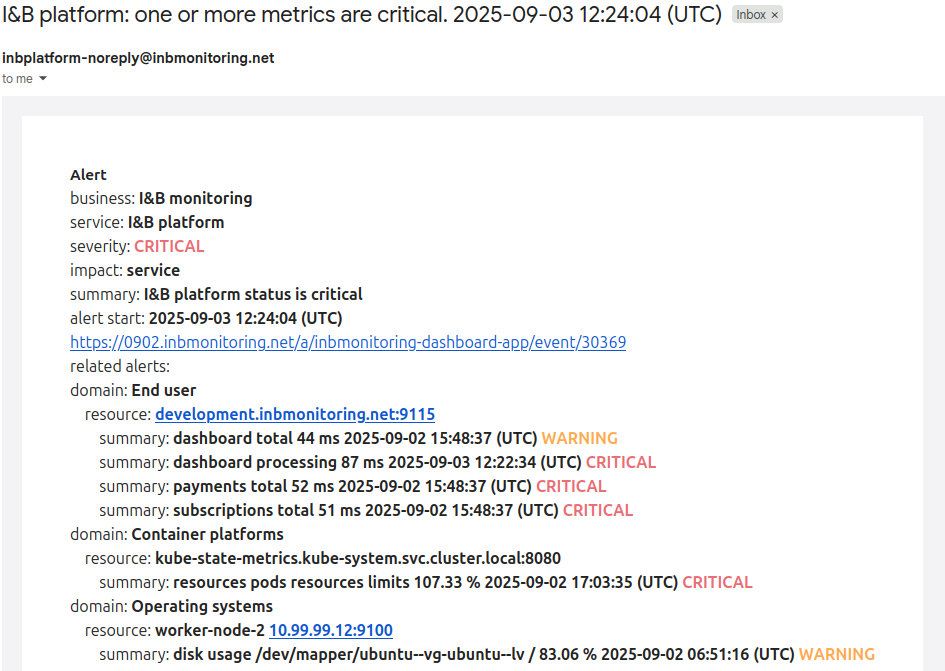
It provides clear information about:
-
Which service is impacted (here I&B platform)
-
All critical and warning alerts from resources across its layers:
-
End User
-
Container Platforms
-
Operating Systems
-
This helps to identify where the problem is and what the probable root cause might be.
Once the problem is resolved by an engineer, the alert should be deleted from list of alerts. This allows a new issue to be triggered if the situation occurs again.
What goals you can achieve with I&B monitoring platform?
Unified Business and IT services monitoring
Problem
Businesses rely heavily on IT, yet most monitoring tools only display metrics for IT resources (Infrastructure monitoring). Many don’t even show the status of IT services.
Issues in business processes can also seriously affect operations, but there’s often no visibility into the health of the business itself.
I&B monitoring platform offering
-
A single Business Status Dashboard clearly displays the health and details of your business, business units, and IT services.
-
The Overview Dashboard brings together all Subunits or IT Layers metrics from every service and business unit. Subunits and IT layers are monitored using an Anything-as-a-Service (XaaS) approach.
-
Managers can quickly see whether an issue comes from business processes or IT services, enabling fast and accurate decisions.
Single source of truth
Problem
-
Communication between business and IT, and even between IT departments is often inefficient because each team uses its own monitoring tools.
-
There is no shared, clear definition of what a “normal” state looks like for business operations, IT services or infrastructure layers.
I&B monitoring platform offering
-
IT services are presented as Layers that map directly to IT departments, for example: Servers, Databases, Applications.
-
Business units are represented as Subunits, reflecting real-world departments such as Sales, Inventory, Delivery, etc.
-
Every Service, Layer, Business Unit, and Subunit is monitored using the XaaS (Anything-as-a-Service) model and can be viewed on dedicated dashboards as part of the overall Business structure.
-
Information about each component and the business as a whole is accessible to all staff with the appropriate permissions, ensuring everyone works from a single, unified source of truth.
Reduce IT services downtime
Problem
Businesses rely on DevOps teams to quickly detect and resolve issues.
In simple cases, root causes are obvious and can sometimes even be fixed automatically.
But in real environments, service degradation is often difficult to diagnose due to the complexity of IT services, infrastructure and the lack of tools that show all critical data in one place.
I&B monitoring platform offering
-
All metrics that exceed warning or critical thresholds are displayed in a single Service Details dashboard.
-
Issues are grouped by IT Layers or Business Subunits, showing only information relevant to the current situation.
-
This focused view significantly reduces MTTD (Mean Time to Diagnose).
Too Few or Too Many Alerts (Alert Spam / Event Fatigue)
Problem
Monitoring systems often create information overload and notification spam.
One of the biggest challenges is correctly configuring when alerts and incidents should be triggered. Many setups fail for one or both of these reasons:
-
Too few alerts: Important issues may be missed, leading to serious failures if problems aren’t caught early.
-
Too many alerts: Critical messages get lost in a flood of minor notifications, which quickly start to feel like spam. The result is the same - early warning signs of major issues are overlooked.
I&B monitoring platform offering: events grouping
-
The platform distinguishes between events and alerts across all levels: IT components (Resources), Layers (Subunits), Services (Business Units), and the overall Business.
-
It separates simple threshold-crossing events from true outages (alerts).
-
It separates the impact of each alert by level: Resource, IT Layer (XaaS) / Business Subunit, and IT Service / Business Unit.
-
For serious issues, only the relevant Layer, Service, or Business-level alerts are sent to the responsible people - avoiding unnecessary noise.
-
When an issue is created, it automatically includes all relevant and important information (alert context).
-
This approach prevents alert flapping, reduces spam, and ensures all important related data remains available through connected events and alerts.
Integration with issue management systems
Problem
Issues in an IT service, business unit, or IT component must not only be detected — they must be tracked until fully resolved.
However, the resolution process usually happens in separate systems such as issue trackers, incident systems, or ticketing tools.
Manually creating issues is time-consuming, and without two-way integration, tracking progress becomes difficult and inefficient.
I&B monitoring platform offering
-
Provides out-of-the-box integration with Jira or email-based ticketing systems (with more integrations planned).
-
Automatically assigns issues to the responsible person based on the type of problem.
-
Saves the created issue’s ID, allowing engineers and managers to open it directly from the I&B monitoring platform.
Use based on best practices templates
Problem
Many companies still do not have a clearly defined “normal state” for their services or IT components.
The challenge is not only configuring the right thresholds, but also making these definitions visible, agreed upon, and aligned across all teams that support the service (see Single Source of Truth).
I&B platform offering
-
Provides ready-to-use templates based on industry best practices.
-
Each template defines both key metrics (important for the Layer engineer) and XaaS metrics, which are essential for other teams and for understanding the Service as a whole.
-
All metrics that define the status of IT components, Layers, Services, and the Business are accessible to every support team member.
What next?
We have prepared step-by-step getting started guide with examples how to configure platform to monitor your Infrastructure, IT Services and Business.
In section Resources for getting started guide we have provided necessary resources, templates and metrics so you have all at your hands to getting started and become familiar with I&B monitoring platform.