
To access and manage templates navigate to 
View list of templates
There is a list of predefined templates, that are grouped by operation subdomains:
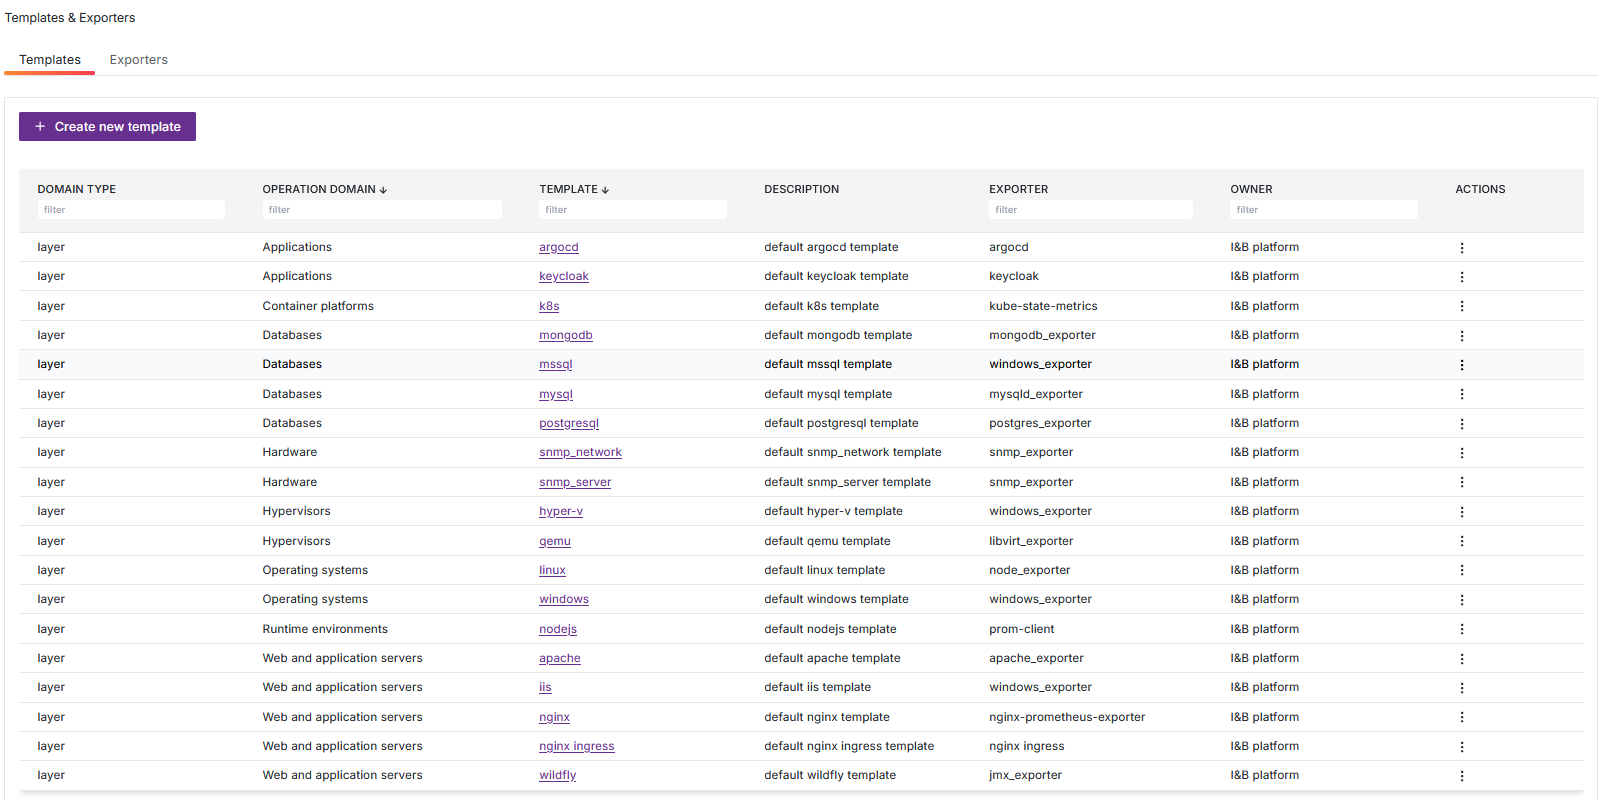
View list of metrics
Click on template name, brings you to set of template’s metrics:
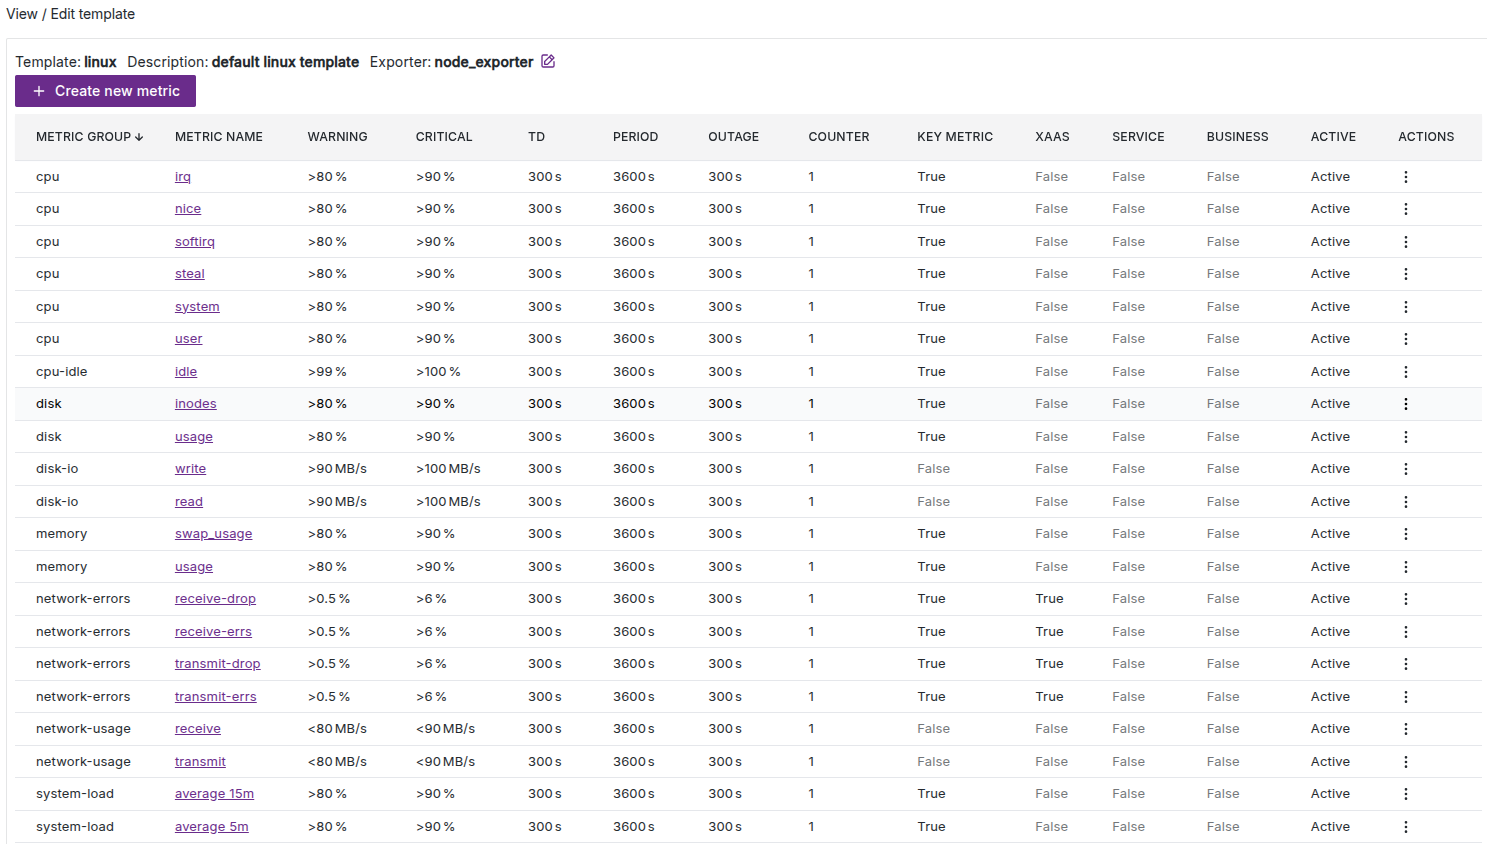
Here you can review thresholds, issue creating conditions and other information.
View / edit metric
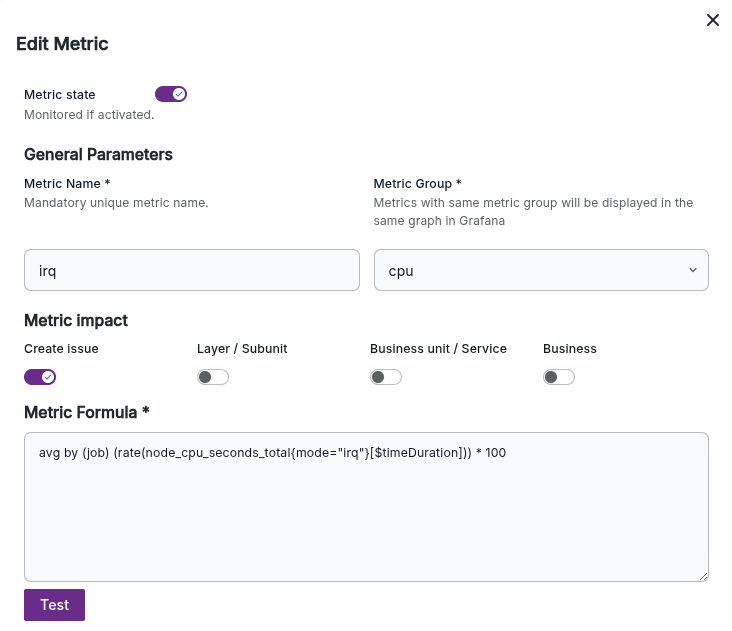
Clicking on metric name opens metric editing dialog:
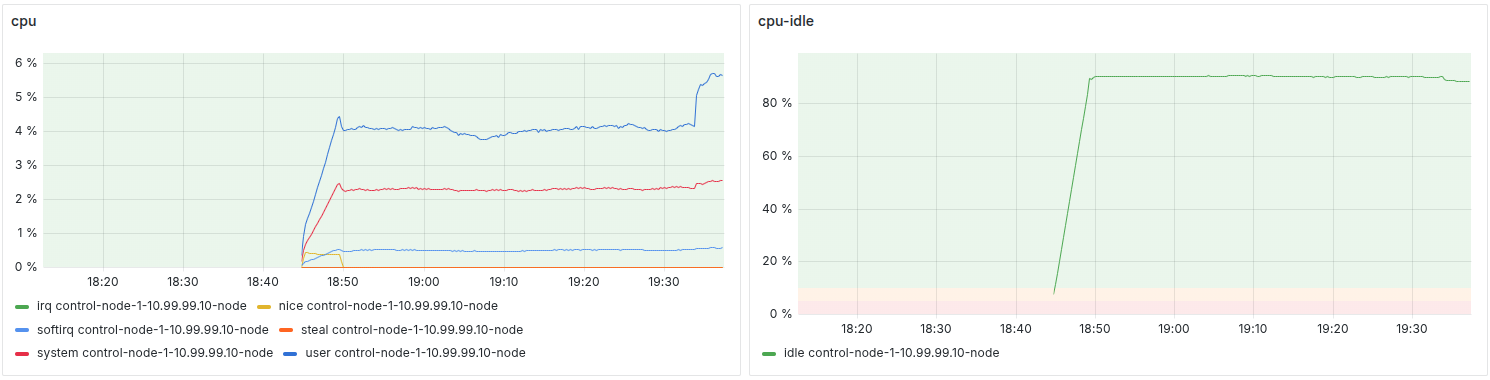
Metric name as well as resource name is part of legend in charts.
Metric group (here cpu) defines panel name. Metrics from the same group will be displayed together. Ensure you review the measurement units and threshold values carefully.
Displaying metrics with different units of measurement and value scales in the same panel can reduce readability. For instance, cpu_system and cpu_idle have distinct threshold values, so it's recommended to display them in separate panels for better clarity.
Metric Formula defines what metric will be selected with PromQL (Prometheus Query Language). For example:
avg by (job) (rate(node_cpu_seconds_total{mode="irq"}[$timeDuration])) * 100
Pay attention to $timeDurationvariable - in query it will be substituted with value from Time duration field (period in seconds of metric measurement - moving window).
Metric impact
Create issue - in case metric will cross critical threshold for more then defined in Outage duration or will cross thresholds more then Counter times, issue will be created.
See section 7. Add issue tracking system.
The Layer/Subunit, Service/Business Unit, and Business levels determine whether a metric reflects the operational status or the domain of operation. Accordingly, the metric will appear on the corresponding dashboard.