
Metric group: requests rate
|
Metric name |
Formula |
M |
Warning |
Critical |
Period |
Outage |
Counter |
Issue |
Layer |
Service |
Business |
|---|---|---|---|---|---|---|---|---|---|---|---|
|
get user |
rate (http_requests_total{route="/v2/user/:email", method="GET", status="200"}[60s]) or on() vector(0) |
r/s |
< 0 |
< 0 |
600s |
300s |
1 |
false |
false |
false |
false |
|
get organisation |
rate (http_requests_total{route="/v2/organisation/:orgId", method="GET", status="200"}[60s]) or on() vector(0) |
r/s |
< 0 |
< 0 |
600s |
300s |
1 |
false |
false |
false |
false |
|
get order |
rate (http_requests_total{route="/v2/order/organisation/:orgId", method="GET", status="200"}[60s]) or on() vector(0) |
r/s |
< 0 |
< 0 |
600s |
300s |
1 |
false |
false |
false |
false |
|
create order |
rate (http_requests_total{route="/v2/order", method="POST", status="201"}[60s]) or on() vector(0) |
r/s |
< 0 |
< 0 |
600s |
300s |
1 |
false |
false |
false |
false |
Metric group: duration
|
Metric name |
Formula |
M |
Warning |
Critical |
Period |
Outage |
Counter |
Issue |
Layer |
Service |
Business |
|---|---|---|---|---|---|---|---|---|---|---|---|
|
get user |
round (rate (http_request_duration_seconds_sum{method="GET",route="/v2/user/:email",status="200"}[300s]) /
|
ms |
> 40 |
> 50 |
600s |
300s |
1 |
true |
true |
true |
false |
|
get organisation |
round (rate (http_request_duration_seconds_sum{method="GET",route="/v2/organisation/:orgId"}[60s]) /
|
ms |
> 40 |
> 50 |
600s |
300s |
1 |
true |
true |
true |
false |
|
get order |
round (rate (http_request_duration_seconds_sum{method="GET",route="/v2/order/organisation/:orgId"}[60s]) /
|
ms |
> 40 |
> 50 |
600s |
300s |
1 |
true |
true |
true |
false |
|
create order |
round (rate (http_request_duration_seconds_sum{method="POST",route="/v2/order"}[60s]) /
|
ms |
> 40 |
> 50 |
600s |
300s |
1 |
true |
true |
true |
false |
Metric group: errors rate
|
Metric name |
Formula |
M |
Warning |
Critical |
Period |
Outage |
Counter |
Issue |
Layer |
Service |
Business |
|---|---|---|---|---|---|---|---|---|---|---|---|
|
get user |
rate (http_requests_total{route="/v2/user/:email", method="GET", status="500"}[60s]) and on() (rate (http_requests_total{route="/v2/user/:email", method="GET", status="500"}[60s]) > 0) or on() vector(0) |
errors/s |
>= 1 |
>= 1 |
600s |
300s |
1 |
true |
true |
true |
false |
|
get organisation |
rate (http_requests_total{route="/v2/organisation/:orgId", method="GET", status="500"}[60s]) and on() (rate (http_requests_total{route="/v2/organisation/:orgId", method="GET", status="500"}[60s]) > 0) or on() vector(0) |
errors/s |
>= 1 |
>= 1 |
600s |
300s |
1 |
true |
true |
true |
false |
|
get order |
rate (http_requests_total{route="/v2/order/organisation/:orgId", method="GET", status="500"}[60s]) and on() (rate (http_requests_total{route="/v2/order/organisation/:orgId", method="GET", status="500"}[60s]) > 0) or on() vector(0) |
errors/s |
>= 1 |
>= 1 |
600s |
300s |
1 |
true |
true |
true |
false |
|
create order |
rate (http_requests_total{route="/v2/order", method="POST", status="500"}[60s]) and on() (rate (http_requests_total{route="/v2/order", method="POST", status="500"}[60s]) > 0) or on() vector(0) |
errors/s |
>= 1 |
>= 1 |
600s |
300s |
1 |
true |
true |
true |
false |
Tips and tricks
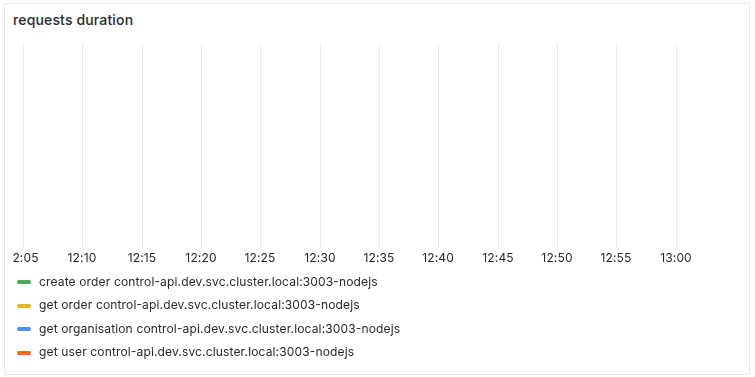
You probably notice, that in requests duration metrics group there is denominator (for example: rate (http_requests_total{route="/v2/user/:email", method="GET", status="200"}[60s]) that could be 0. In this case Prometheus returns NaN value of formula, so chart looks like:
Tips and tricks
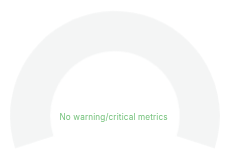
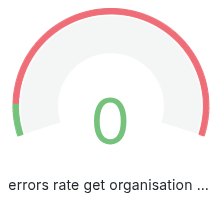
You probably noted expression or on() vector(0). It adds 0 value in Prometheus response. If there are no errors expression rate (http_requests_total{route="/v2/order/organisation/:orgId", method="GET", status="200"}[60s]) will return no values in case no data. So your chart will looks like:
It’s probably ok but with or on() vector(0) can be even better:
how to read this formula?:
rate (http_requests_total{route="/v2/user/:email", method="GET", status="500"}[60s])
and on() (rate (http_requests_total{route="/v2/user/:email", method="GET", status="500"}[60s]) > 0)
or on() vector(0)
Essentially it is expression of
if rate (http_requests_total{route="/v2/user/:email", method="GET", status="500"}[60s]) >= 0
then return rate (http_requests_total{route="/v2/user/:email", method="GET", status="500"}[60s])
else return 0 // in case no data
in PromQL.