
Overall schema of collecting and exposing such metrics is shown in picture below.
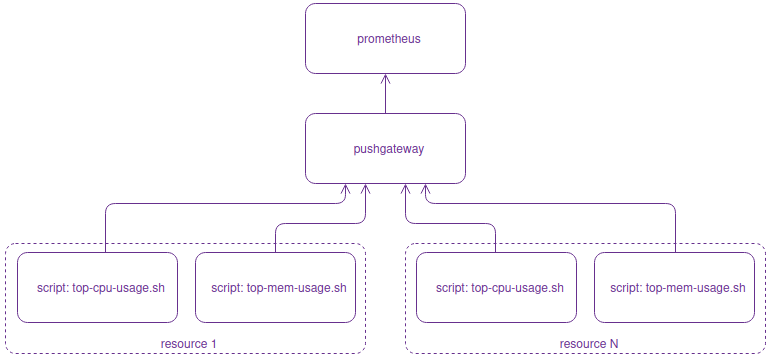
Scripts collect information from resource and push it to Pushgateway. Pushgateway cache it and expose in Prometheus format.
So high level steps to collect Top N CPU and MEM usage metrics are:
-
Create script, service and timer to collect Top N CPU usage process;
-
Create script, service and timer to collect Top N MEM usage process.
Detailed step by step guide is provided below.
Create script, service and timer to collect Top N CPU usage processes
Create top CPU processes usage script
-
Create file in your preferable text editor, for example:
sudo nano /usr/local/bin/pushgateway/top-cpu-usage.sh
while pasting into it following code, replace:
-
exporter_user:passwordwith with respective values while you configure authentication -
pushgateway-hostname-or-ipaddress:portwith respective values from your Pushgateway installation. -
resource-hostname-or-ipaddresswith respective values from what resource you are collecting data.
#!/bin/bash

CPU_USAGE="# TYPE cpu_usage gauge\n"
CPU_USAGE+="$(ps aux --sort %cpu  | tail -6 | awk '{print "cpu_usage{process=\""$11"\", pid=\""$2"\"}", $3z}')"
CPU_USAGE=$(echo "$CPU_USAGE" | sed 's/cpu_usage{/\ncpu_usage{/')

cat <<EOF | echo -e "${CPU_USAGE}" | curl -k -u 'exporter_user:password' --data-binary @- \
    https://pushgateway-hostname-or-ipaddress:port/metrics/job/resource-hostname-or-ipaddress-pgw/instance/resource-hostname-or-ipaddress
EOF
Save file and exit editor.
Please pay attention to add
-pgw after resource-hostname-or-ipaddress after /job/ in path, for example: .../job/192.168.100.1-pgw/...
tail -6 option here defines number of top 6 processes that will be shown. You can adjust this number if needed. Including too many processes could result large processes list in dashboard.
-
Set permissions for script so nobody except
prometheusorrootuser can read user:password
sudo chown prometheus:prometheus /usr/local/bin/pushgateway/top-cpu-usage.sh
sudo chmod 700 /usr/local/bin/pushgateway/top-cpu-usage.sh
Create top-cpu-usage.service
-
Create with your preferred text editor file
/etc/systemd/system/top-cpu-usage.service, for example:
sudo nano /etc/systemd/system/top-cpu-usage.service
and paste into it following code:
[Unit]
Description=top-cpu-usage
After=network.target

[Service]
User=prometheus
Group=prometheus
Type=oneshot
ExecStart=/usr/local/bin/pushgateway/top-cpu-usage.sh

[Install]
WantedBy=multi-user.target
-
Save file and exit editor.
-
Start service
sudo systemctl daemon-reload
sudo systemctl enable --now top-cpu-usage.service
Create timer for service
Create file with timer …
sudo nano /etc/systemd/system/top-cpu-usage.timer
… and paste following code into it
[Unit]
Description=Run top-cpu-usage service every 15s

[Timer]
OnUnitActiveSec=15s
AccuracySec=1s
Unit=top-cpu-usage.service

[Install]
WantedBy=timers.target
Save file and exit editor.
OnUnitActiveSec=15s - defines that service that collects CPU usage data will be run every 15 seconds.
Start timer:
sudo systemctl daemon-reload
sudo systemctl start top-cpu-usage.timer
sudo systemctl enable top-cpu-usage.timer
In case problems run
systemd-analyze verify /etc/systemd/system/top-cpu-usage.*
Create script, service and timer to collect top MEM usage processes
Create top MEM processes usage script
-
Create file:
sudo nano /usr/local/bin/pushgateway/top-mem-usage.sh
while pasting into it following code, replace:
-
exporter_user:passwordwith with respective values while you configure authentication -
pushgateway-hostname-or-ipaddress:portwith respective values from your Pushgateway installation. -
resource-hostname-or-ipaddresswith respective values from what resource you are collecting data.
#!/bin/bash

MEM_USAGE="# TYPE memory_usage gauge\n"
MEM_USAGE+="$(ps aux --sort %cpu  | tail -6 | awk '{print "memory_usage{process=\""$11"\", pid=\""$2"\"}", $3z}')"
MEM_USAGE=$(echo "$MEM_USAGE" | sed 's/memory_usage{/\nmemory_usage{/')

cat <<EOF | echo -e "${MEM_USAGE}" | curl -k -u 'exporter_user:password' --data-binary @- \
    https://pushgateway-hostname-or-ipaddress:port/metrics/job/resource-hostname-or-ipaddress-pgw/instance/resource-hostname-or-ipaddress
EOF
Please pay attention to add
-pgw after resource-hostname-or-ipaddress after /job/ in path, for example: .../job/192.168.100.1-pgw/...
tail -6 option here defines number of top 6 processes that will be shown. You can adjust this number if needed. Including too many processes could result large processes list in dashboard.
-
Set permissions for script so nobody except
prometheusorrootuser can read user:password
sudo chown prometheus:prometheus /usr/local/bin/pushgateway/top-mem-usage.sh
sudo chmod 700 /usr/local/bin/pushgateway/top-mem-usage.sh
Create service
Create file:
sudo nano /etc/systemd/system/top-mem-usage.service
and paste into it following code:
[Unit]
Description=top-mem-usage
After=network.target

[Service]
User=prometheus
Group=prometheus
Type=oneshot
ExecStart=/usr/local/bin/pushgateway/top-mem-usage.sh

[Install]
WantedBy=multi-user.target
Save file and exit.
Start service
sudo systemctl daemon-reload
sudo systemctl enable --now top-mem-usage.service
Create timer for service
Create file with timer …
sudo nano /etc/systemd/system/top-mem-usage.timer
… and paste following code into it
[Unit]
Description=Run top-mem-usage service every 15s

[Timer]
OnUnitActiveSec=15s
AccuracySec=1s
Unit=top-mem-usage.service

[Install]
WantedBy=timers.target
Save file and exit.
OnUnitActiveSec=15s - defines that service that collects CPU usage data will be run every 15 seconds.
Start timer:
sudo systemctl daemon-reload
sudo systemctl start top-mem-usage.timer
sudo systemctl enable top-mem-usage.timer
Check timer status
sudo systemctl status top-mem-usage.timer
You should see output like this:

In case problems run
systemd-analyze verify /etc/systemd/system/top-mem-usage.*
Check configuration
To check CPU and MEM metrics are exposed by pushgateway open in browser https://pushgateway-hostname-or-ip:port/metrics
You should see in page data like this:
# TYPE cpu_usage gauge
cpu_usage{instance="lab",job="lab-pgw",pid="1127",process="/usr/bin/gnome-shell"} 0
cpu_usage{instance="lab",job="lab-pgw",pid="1140",process="/usr/sbin/rsyslogd"} 0
cpu_usage{instance="lab",job="lab-pgw",pid="17655",process="/usr/bin/python3"} 0
cpu_usage{instance="lab",job="lab-pgw",pid="17664",process="/usr/bin/python3"} 0
cpu_usage{instance="lab",job="lab-pgw",pid="1770",process="sshd-session:"} 0

...
# TYPE memory_usage gauge
memory_usage{instance="lab",job="lab-pgw",pid="1",process="/usr/lib/systemd/systemd"} 1.4
memory_usage{instance="lab",job="lab-pgw",pid="1127",process="/usr/bin/gnome-shell"} 8.8
memory_usage{instance="lab",job="lab-pgw",pid="17655",process="/usr/bin/python3"} 1.9
memory_usage{instance="lab",job="lab-pgw",pid="17664",process="/usr/bin/python3"} 1.8
memory_usage{instance="lab",job="lab-pgw",pid="48987",process="/usr/local/bin/pushgateway/pushgateway"} 1.6
memory_usage{instance="lab",job="lab-pgw",pid="948",process="/usr/bin/python3"} 3.1